Statistics
Edit on GitHub
Last updated September 6, 2019 by Meitar M
NYC Mesh publishes a real-time statistical display of network traffic flowing into and out of our various network stations on the Web site at stats.nycmesh.net (IP address 199.167.59.7). An example screenshot is shown in Figure 1:
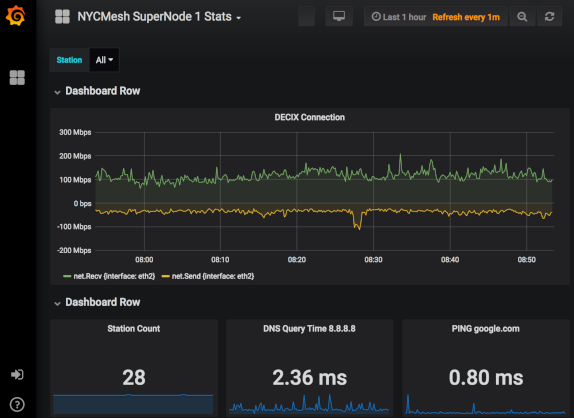
Figure 1: Dashboard of stats.nycmesh.net showing traffic flows through various stations.
The graphing software is Grafana.